Sailboats by the Numbers
Boat reviewers rely on numbers to describe some of the key attributes of their subjects, such as length, beam, draft, and displacement. And while judgments on interior layouts and decor are subjective, these figures describing dimensions are not. There are, however, other numbers commonly cited in spec boxes that can prove more elusive, since they attempt to put a numerical value on how a sailboat might be expected to perform while under way. The commonly used ratios are sail area to displacement (SA/D), displacement to length (D/L), and ballast to displacement (B/D). And though they’re so commonly used that a certain amount of dogma has accrued around them, these figures can, in fact, be misleading, or at least misunderstood. And the result is that a boat can be assigned attributes based on numerical values that don’t take into account how sailboat design has changed over the past several decades.
Here, then, is a look at those ratios, what they attempt to describe, and how they should be interpreted when you go off exploring new and used models. (Click to page 2 for a more in-depth explanation.)
**
Sail Area/Displacement (SA/D)**
An automobile buff seeking a high-performance ride looks for a high power-to-weight ratio and compares the horsepower/curb-weight ratios of different cars.
For a sailboat, the SA/D provides the same metric. The horsepower comes from the wind on the sails and is proportional to the sail area; a boat’s weight is its displacement (in pounds, kilograms, or tons).
Initially, the SA/D only really gives a measure of potential acceleration rates (in case any physicists are reading this), but since displacement is a key factor in the resistance a boat encounters when moving through the water, SA/D also has a bearing on potential maximum speed.
The traditional calculation for SA/D compares sail area in square feet to displacement in cubic feet. In the formula, displacement in pounds is divided by 64 (the density of seawater) to obtain cubic feet, which are in turn converted to square feet to make the ratio unit-free.
On a spreadsheet, the formula would be S/(D/64)(2/3).
Nominally, the higher the SA/D, the more lively the boat’s sailing performance. The vessel will accelerate more quickly and have the potential for higher speed.
But to be able to compare boats with any degree of precision (or fairness), we have to use similar numbers. The displacement must be in the same condition, either light ship (nothing on board) or fully loaded, and the sail-area measurement must reflect the normal working sail plan. Racing boats have measurement certificates from which these numbers can be reliably extracted. The specifications provided in cruising-boat brochures might not be consistent between builders, but we have to assume they are.
Boats measured in the 1970s and the 1980s for racing under the International Offshore Rule for the most part had SA/Ds between 16 and 17, based on the sum of the mainsail triangle (M = PE/2) and 100-percent foretriangle area (100%FT = IJ/2). The measurement system favored small mainsails and large headsails, and since designers of cruising boats stuck close to the IOR sail plan, the IOR value for SA/D became the yardstick. An SA/D above 17 said “fast boat,” and anything below 16 said “slow boat.”
After the IOR fell out of favor, cruising-boat design drifted away from raceboat design, and sail plans began to change. Today, many boats are designed with large mainsails and small jibs, and most builders publish a “total sail area” number that includes the standard jib (often as small as 105 percent) and the roach in the mainsail (which is significantly greater on modern boats with full-battened mainsails than on IOR boats).
These builder-supplied numbers are more readily comparable against competing models, but using them in the SA/D formula makes the boats look “faster” than older models. This is a false comparison, because the sail area used for the older boats doesn’t include the extra area in, say, a 150-percent genoa.
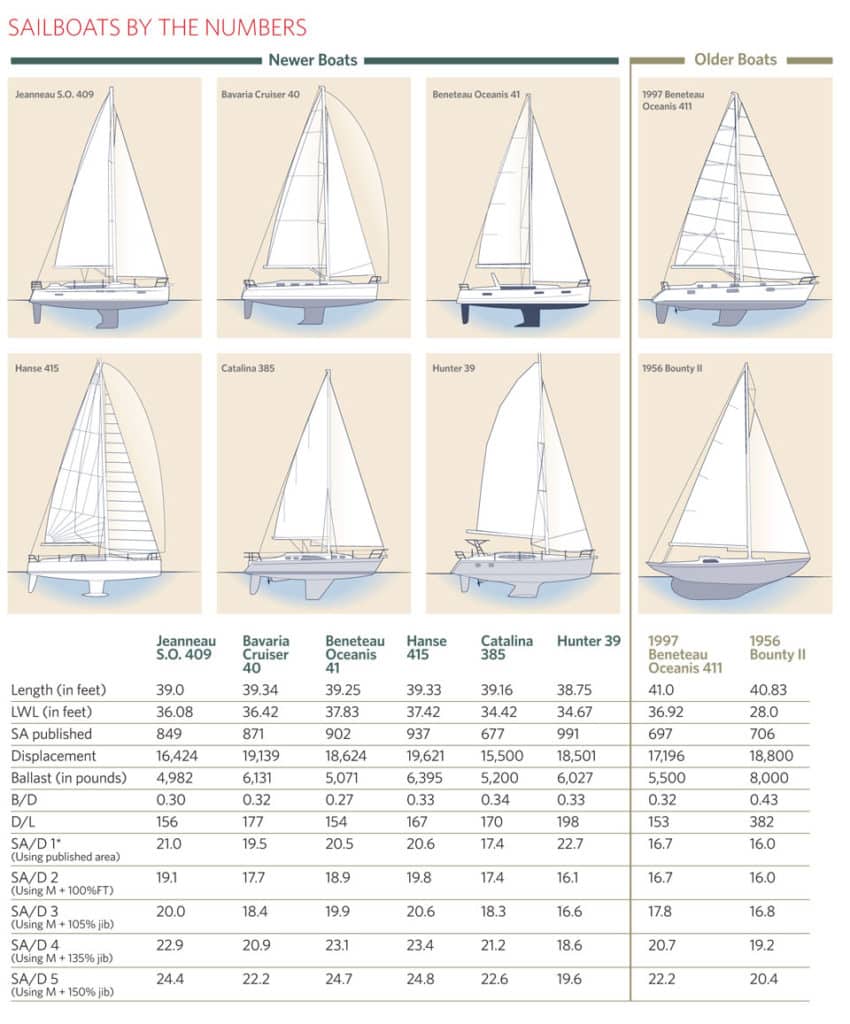
The table “Sailboats by the Numbers” (see page 79) illustrates this. It shows SA/Ds calculated for a selection of modern boats and boats from past eras, all about the same length, using different numbers for sail area. For each model, it shows five SA/Ds. SA/D 1 is calculated using the sail area provided by the builder. SA/D 2 is calculated using M (PE/2) and 100% FT (IJ/2). SA/D 3 is calculated using M + 105% jib. SA/D 4 is calculated using M + 135% jib. SA/D 5 is calculated using M + 150% jib. The only SA/D that includes mainsail roach is SA/D 1.
Let’s look at some examples. The 1997 Beneteau Oceanis 411 has a published sail area of 697 square feet on a displacement of 17,196 pounds. That gives an SA/D 1 of 16.7 (the same as SA/D 2), which for decades was considered very respectable for a cruising boat.
In 2012, the current Beneteau Oceanis 41 has a published sail area of 902 square feet (453 mainsail + 449 jib) and a published displacement of 18,624 pounds, to give an SA/D 1 of 20.5. Wow! Super-high performance! But this is for the standard sail area, with the 449-square-foot jib (just about 100% FT and typical of the trend today toward smaller jibs that tack easily). Plug in the calculation using I, J, P, and E and SA/D 2 drops to 18.9 because it doesn’t include mainsail roach, which is about 16 percent of the total published mainsail area.
Go back to the 1997 model, tack on a standard-for-the-day 135-percent genoa, and the SA/D 4 becomes 20.7. (If we added in mainsail roach, typically about 11 percent of base mainsail area before full-battened sails, we’d have 21.4.) The 1997 boat has essentially the same horsepower as the 2012 model.
Looking at current models from other builders, the SA/Ds based on published numbers hover around 20, suggesting that designers agree on the horsepower a cruising sailboat needs to generate adequate performance to windward without frightening anyone.
The two boats in our chart that don’t at first appear to fit this model are the Hunter 39 and the Catalina 385, but they’re not really so far apart.
The Hunter’s SA/D 2 is 16.1. Its standard jib is 110 percent (327 square feet), and the rest of the published sail area is in the mainsail—664 square feet, of which 37 percent is roach!
Catalina is a little more traditional in its thinking. If you add the standard 135-percent genoa, the SA/D becomes 21.2—right in the ballpark. (It’s still there at 19.7 with a 120-percent genoa.)
The table shows that, for boats targeted at the “performance cruising” market, the SA/D numbers using actual sail area lie consistently around the 20 mark. To go above that number, you have to be able to fly that sail area without reefing as soon as the wind ripples the surface. To do that, you have to elevate stability—with broad beam, lightweight (i.e., expensive) construction, deep bulb keels, and fewer creature comforts.
**
Displacement/Length (D/L)**
While sailboat builders and buyers are interested in displacement in terms of weight, naval architects view it as volume; they’re creating three-dimensional shapes. When working in feet, to get a displacement in pounds, they multiply cubic feet by 64, the density in pounds per cubic foot of seawater. (Freshwater boats displace more volume because the density of fresh water is only 62.4.) The D/L ratio is therefore a measure of immersed volume per unit of length—how tubby the hull is below the waterline.
According to conventional wisdom and empirical studies, the lower the D/L, the higher the performance potential. This is mainly due to wavemaking resistance being lower for slender hulls than for tubby hulls.
In the D/L formula, displacement in pounds is divided by 2,240 to convert it to tons to bring the values to manageable numbers, so D/L is displacement in tons divided by .01LWL (in feet) cubed.
In a spreadsheet, the formula would be D/(2240*(.01L)3), where D is the displacement in pounds and L is LWL in feet.
In the early days of fiberglass boats, the Cruising Club of America rule was the principal dictator of boat shapes. Because it was a waterline rule, designers kept waterlines short to keep ratings low and relied on long stern overhangs immersing to add “sailing length” when the boats heeled. Carbon fiber was available only to NASA, and boats had full interiors, so “light displacement” wasn’t really in the cards. A D/L of 300 was considered dashing, even risky. Many still-popular designs from the 1970s and 1980s have D/Ls as high as 400; see the Bounty II.
Fast-forward 40 years. Boats now have plumb bows and plumb sterns and waterlines almost as long as their LOAs—there are no rating penalties on a cruising boat. The boats’ weights haven’t changed much because, although builders try to save weight to save cost, the boats are so much bigger. The hull and deck surface areas are greater, and all that extra internal volume can be filled with furniture. The effect on D/L ratios has been drastic—just look at the table. A D/L ratio above 200 today describes a heffalump.
But do these lower D/Ls actually buy you any more speed? Yes and no.
Yes: Because speed is proportional to the square root of the waterline length. Today’s 40-footer has a much longer waterline than yesterday’s and ought to sail as fast as yesterday’s 50-footer. It might also benefit from reduced resistance due to a smaller cross-sectional area, but it also might have greater wetted-surface drag due to the longer immersed length. When sailing downwind in waves, though, the lower-D/L boat will surf more readily.
No: Because, as we saw above, the power-to-weight ratios (SA/D) of modern boats aren’t effectively any higher, and certainly aren’t in the realm that would allow our cruising sailboats to climb out of the displacement zone and plane. In most conditions, the lower-D/L boat is still trapped in its wave.
In the days of the IOR, a D/L of 250 was still pretty racy; see the 1978 Catalina 38. Today, even a D/L as low as 150 doesn’t make a boat a speedster if it can’t carry the sail area to make it so. To compete at a level with a Volvo 70, look for a D/L of about 40 and an SA/D of 65.
**
Ballast/Displacement (B/D)**
The ballast/displacement ratio is simply the ballast weight divided by the boat’s total displacement. Since ballast is there to give the boat stability, it’s easy to jump to the conclusion that the higher the B/D, the stiffer the boat.
However, B/D doesn’t take into account the location of the ballast.
Take a boat that has a total displacement of 20,000 pounds and put its 8,000 pounds of ballast in the bilge. Now take the same boat and put the 8,000 pounds of ballast 4 feet deeper in a bulb at the bottom of a deep fin keel. Same ballast ratio (0.4), but very different stability.
When looking at B/D, therefore, we must ask about the configuration of the keel: How low is the ballast?
Stability analysis is complex and involves beam, hull cross-section, and length, among other factors, of which B/D is just one.
Since the late 1990s, builders of sailboats intended for sale in the European Union have been required to provide stability data, including a curve of righting arm at angles of heel from 0 to 180 degrees—far more information than anyone can divine from a B/D number and a much more useful measure of a boat’s inclination to stay upside down in the unlikely event (the way most people use their boats) that it exceeds its limit of positive stability.
CW contributing editor Jeremy McGeary is a seasoned yacht designer who’s worked in the naval-architecture offices of David Pedrick, Rodger Martin, and Yves-Marie Tanton and as a staff designer for Camper & Nicholson.
To read the related article, How To: Measure Sail Area, click here.

